Every Men's T20 World Cup Final, By the Numbers: Why Finals Are a Different Game
Ten finals, from Johannesburg in 2007 to 2026. We hold every ball of all of them. Line them up and a pattern appears that contradicts everything modern T20 has taught us about scoring: the biggest match of the tournament is almost always the quietest.
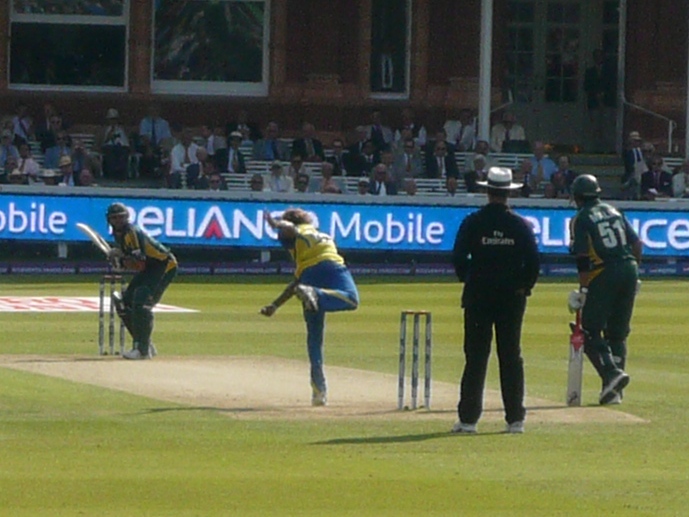
Modern T20 cricket is a scoring arms race. Averages climb every year, 200 is routine in franchise leagues, and a bowler going at nine an over is considered to have done a job. Then the World Cup final arrives, and the sport seems to revert to an earlier decade.
We hold every delivery of all ten men's T20 World Cup finals in our own database. Laid side by side, they make an unusually clear argument: the final is not simply another match with a trophy attached. It is a measurably different, and lower scoring, kind of cricket.
All ten finals, as they happened
2007, Johannesburg. India beat Pakistan by 5 runs. India 157 for 5, Pakistan 152 all out in 19.3 overs. The first final of them all, decided in the last over. A tournament India entered without several senior players ended with the trophy and changed Indian cricket's relationship with the format permanently.
2009, Lord's. Pakistan beat Sri Lanka by 8 wickets. Sri Lanka 138 for 6, Pakistan 139 for 2 in 18.4 overs. The most comfortable chase in final history and the least characteristic: Pakistan, so often chaotic, controlled this one from the fourth over.
2010, Bridgetown. England beat Australia by 7 wickets. Australia 147 for 6, England 148 for 3 in 17 overs. England's first global white-ball trophy, and a rare final where the chasing side never looked troubled.
2012, Colombo. West Indies beat Sri Lanka by 36 runs. West Indies 137 for 6, Sri Lanka 101 all out in 18.4 overs. The lowest winning total in final history, and the largest margin until 2026. Sri Lanka, at home, were bowled out chasing 138.
2014, Mirpur. Sri Lanka beat India by 6 wickets. India 130 for 4, Sri Lanka 134 for 4 in 17.5 overs. India's lowest first-innings total in any final. Sri Lanka's senior pair finally collected the trophy that had eluded them across multiple finals.
2016, Kolkata. West Indies beat England by 4 wickets. England 155 for 9, West Indies 161 for 6 in 19.4 overs. Carlos Brathwaite's four consecutive sixes in the final over remain the most famous passage of play in the tournament's history.
2021, Dubai. Australia beat New Zealand by 8 wickets. New Zealand 172 for 4, Australia 173 for 2 in 18.5 overs. The highest chase completed in a final.
2022, Melbourne. England beat Pakistan by 5 wickets. Pakistan 137 for 8, England 138 for 5 in 19 overs. A final played in bowler-friendly conditions where 138 was genuinely competitive deep into the chase.
2024, Bridgetown. India beat South Africa by 7 runs. India 176 for 7, South Africa 169 for 8 in 20 overs. South Africa needed 30 from 30 balls with six wickets standing and lost.
2026. India beat New Zealand by 96 runs. India 255 for 5, New Zealand 159 all out in 19 overs. The outlier that proves the rule: the only 200-plus total in final history, the largest margin ever, and the first time a final has looked like a modern T20 match.
The pattern: finals are quiet
Nine of the ten finals produced a first-innings total under 180. The average first-innings score across all ten is 160 runs. Remove the 2026 outlier and it falls to 150.
Set that against the wider game. Over the same period, our IPL data shows league-average innings totals climbing from 148 to 188. Modern franchise cricket routinely produces 190 and beyond. Yet World Cup finals kept producing 130 to 160 well into the 2020s.
More striking still: only one final in nineteen years has crossed 200, and it happened in 2026. For the first nine finals, the highest total anyone managed was India's 176 in 2024, with New Zealand's 172 in 2021 the next best.
Three sides were bowled out in a final: Pakistan for 152 in 2007, Sri Lanka for 101 in 2012, and New Zealand for 159 in 2026. Being dismissed inside 20 overs is uncommon in elite T20, which tells you something about how these matches are played.
Why does scoring fall in the biggest match?
The data describes the effect. It cannot fully explain it, and being honest about that distinction matters. So here are the plausible reasons, clearly labelled as interpretation rather than proof.
Pressure changes shot selection. Batters take fewer risks when the cost of failure is a lost final. Fewer risks means fewer boundaries, and in T20 a small drop in boundary frequency produces a large drop in total.
Finals are played on used pitches. A final is the last match of a long tournament at a venue that has often hosted several games already. Worn surfaces favour bowlers, especially spinners through the middle overs.
The best bowlers are still standing. Teams that reach a final generally do so because their bowling has held up. You are watching the tournament's strongest attacks on its most helpful surfaces.
Neutral, unfamiliar conditions. Unlike a league season, a World Cup final is often played in conditions neither side knows well, which favours caution.
What changed in 2026?
The 2026 final broke every pattern above: 255 batting first, a 96-run margin, and an opposition bowled out. One match is not a trend, and we will not pretend otherwise. But it is consistent with what our wider data has shown for several years. Scoring across the whole sport has risen sharply since 2023, and it was always likely the finals would eventually follow.
Whether 2026 marks the moment the final stopped being a low-scoring anomaly, or is simply one flat pitch and one exceptional batting performance, is a question only the next few tournaments can answer. We will have the data either way.
Who actually wins finals
Chasing has been the marginally better side of the coin. Teams batting second won six of the ten finals: Pakistan in 2009, England in 2010, Sri Lanka in 2014, West Indies in 2016, Australia in 2021, and England in 2022. Teams defending won four: India in 2007, West Indies in 2012, India in 2024, and India in 2026.
That is close to an even split, which is itself worth noting, because the modern assumption is that chasing is easier. In finals, it has not been decisively so.
By trophies, India lead with three (2007, 2024, 2026). West Indies and England have two each. Pakistan, Sri Lanka and Australia have one each.
The margins tell the real story
The scorelines hide how close these matches have been. Three finals were decided by margins that could have turned on a single delivery: 5 runs in 2007, 4 wickets with 2 balls remaining in 2016, and 7 runs in 2024.
This is the paradox of the T20 World Cup final. It produces the lowest scores in elite T20 cricket and, precisely because the totals are small, some of the tightest finishes in the sport. When a target is 138 rather than 200, every over matters, and one over can decide a tournament. Brathwaite's four sixes only became legend because the target was small enough for four sixes to be enough.
A note on our data
Every figure here comes from our own database, which holds ball-by-ball records for all ten men's T20 World Cup finals along with the rest of each tournament. We cross-check our records against the published scorecards, and the ten finals above match them.
Where we discuss the wider scoring trend we draw on our IPL data from 2013 onward, and we say so rather than implying we hold every ball ever bowled.
The bottom line
For nineteen years, the biggest match in T20 cricket was also its quietest: an average first innings of 150, not a single total above 176, and three sides bowled out. Then 2026 produced 255. Either the final has finally caught up with modern batting, or we have just watched the exception that defines the rule.
Ten finals is a small sample, and we are wary of grand conclusions from small samples. But the pattern across the first nine was consistent enough to be more than noise, and it is a useful corrective to the idea that T20 is only ever about more runs. When it matters most, the sport has historically tightened up.